You should spend about 20 minutes on this task.
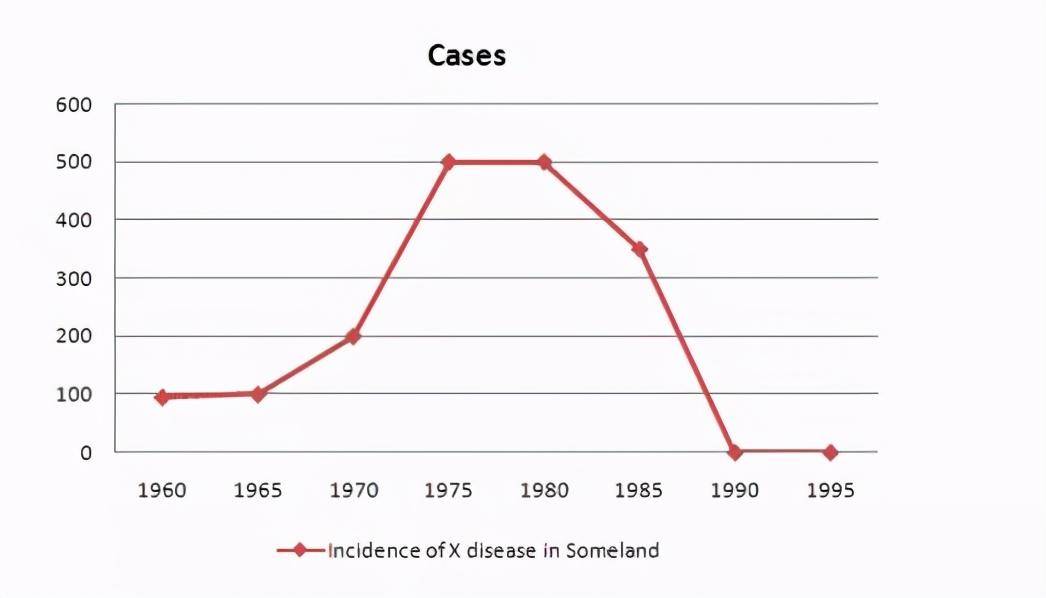
Write a report for a university lecturer describing the information in the graph below.
Write at least 150 words.

完成写作后,你要回顾检查你的文章,看是否满足了要求。
你可以用下面这些标准来核对。
一篇好文章的标准:
报告是否有合适的结构?
是否有介绍、正文、结尾?
是否有连接词汇,将句子和段落通顺地衔接起来?
语法和词汇是否恰当?
是否有长短句搭配?
文中选词是否稳妥?
报告是否满足了题干中的要求?
报告是否满足了字数要求?
图标中的信息是否充分表达出来了?
是否掌握了图表中的重点趋势并详细描述了?
范例答案:
The graph shows the number of cases of X disease in Someland between the years 1960 and 1995. As an overall trend, it is clear that the number of cases of the disease increased fairly rapidly until the mid seventies, remained constant for around a decade at 500 cases before dropping to zero in the late 80s.
In 1960, the number of cases stood at approximately 100. That number rose steadily to 200 by 1969 and then more sharply to 500 in 1977. At this point the number of cases remained stable until 1984 before plummeting to zero by 1988. From 1988 to 1995 Someland was free of the disease.
In conclusion, the graph shows that the disease was increasingly prevalent until the 1980s when it was eradicated from Someland.
你觉得这篇范例文章怎么样?这篇文章满足了题干要求吗?我们来看看专业老师的点评吧。
老师点评
这篇报告的结构很清晰,逻辑性强,介绍、正文、总结三部分很清楚。
考生用了恰当的连接词将各种信息连贯地连接起来,比如第二句中的until和before。
考生还用了不同的语法结构和有变化的词汇让整篇文章不单调不重复。
从题干要求来看,这篇报告稍微有点短,但这也是因为这个单线图表中包含的信息量确实不大,我们用这个简单的例子主要是想让同学们了解单线图表题的解题思路。在真实的雅思考试中,图表会包含