 Yuhua Lin1†
 Yue Wu1†
 Fuqi Ma1†
 Cuiting Shan1
 Jialu Ma1
 Wenguan Li1
 Huayang Pan1
 Xiayi Miao1
 Jinjin Liu1*
 Xiongbiao Wang1*
 Zhenhua Ni2*1Department of Respiratory Medicine, Putuo Hospital, Shanghai University of Traditional Chinese Medicine, Shanghai, China2Central Lab, Putuo Hospital, Shanghai University of Traditional Chinese Medicine, Shanghai, China
Introduction: Qi-Xian Decoction (QXD), a traditional Chinese medicine (TCM) formula consisting of eight herbs, has been clinically used to treat asthma. However, the underlying mechanisms have not been completely elucidated. This study aimed to combine metabolomics and network pharmacology to reveal the mechanism of action of QXD in asthma treatment.
Methods: An ovalbumin (OVA)-induced asthma mouse model was constructed to evaluate the therapeutic effects of QXD. Serum metabolomics and network pharmacology were combined to study the mechanism of anti-asthma action as well as the potential target, and related biological functions were validated.
Results: The QXD treatment has demonstrated significant protective effects in OVA-induced asthmatic mice, as evidenced by its ability to inhibit inflammation, IgE, mucus overproduction, and airway hyperreactivity (AHR). Metabolomic analysis has revealed a total of 140 differential metabolites associated with QXD treatment. In addition, network pharmacology has identified 126 genes that are linked to the effects of QXD, including TNF, IL-6, IL1β, STAT3, MMP9, EGFR, JUN, CCL2, TLR4, MAPK3 and MAPK8. Through comprehensive gene-metabolite interaction network analysis, seven key metabolites have been identified and associated with the potential anti-asthmatic effect of QXD, with palmitic acid (PA) being the most notable among them. In vitro validation studies have confirmed the gene-metabolite interaction involving PA, IL-6, and MAPK8. Furthermore, our research has demonstrated that QXD treatment can effectively inhibit PA-promoted IL-6 expression in MH-S cells and reduce PA concentration in OVA-induced asthmatic mice.
Conclusion: The regulation of metabolic pathways by QXD was found to be associated with its anti-asthmatic action, which provides insight into the mechanism of QXD in treating asthma.
1 IntroductionAsthma is a heterologous disease influenced by complex interactions between multiple environmental exposures, metabolism, and host immunoregulatory processes. Globally, the total number of people with asthma is estimated to be as high as 334 million (Masoli et al., 2004). Asthma kills approximately 250,000 people worldwide every year and has become a heavy burden on society and families (Ferkol and Schraufnagel, 2014). The pathogenesis, physiopathology, and clinical manifestations of asthma are complex and diverse. Current treatment is mainly based on hormone inhalation and bronchodilators, which are often insufficient in effectively controlling the clinical symptoms of asthma. Traditional Chinese medicine (TCM) has a long history of asthma treatment and good clinical efficacy. However, due to the multiple components of TCM, the anti-asthma mechanism of TCM is often complicated, which limits its wide application.
Metabolomics has been utilized for the quantitative and qualitative analysis of the relative relationship between metabolites and physiological and pathological changes. In recent years, metabolomics has played a crucial role in elucidating possible mechanisms by which TCM treats diseases such as cancer and diabetes (Long et al., 2020; Li et al., 2023). In asthma, several metabolites have been identified to affect airway function and respiratory inflammation (Xu et al., 2021; Yip et al., 2021). For example, cytosolic phospholipase A2 and 15-lipoxygenase metabolites play a significant role in the development of airway hyperresponsiveness (AHR) and airway inflammation (Choi et al., 2005; Jeon et al., 2009). However, metabolomics research is limited as it only presents underlying metabolites and associated pathways without further exploring the relationship between the diseases; thus, data analysis and interpretation are urgently required (Tian et al., 2022). Therefore, the identification of differential metabolites and the revelation of their role in asthma pathogenesis aer crucial. Several studies have demonstrated that network pharmacology provides a new method and concept to study the mechanisms of certain ingredients using computational pharmacology based on existing study results. Based on proteomics, systems biology, pharmacology, and disease pathogenesis, the drug-gene-disease relationship was established using network pharmacology. Therefore, combining metabolomics technology and network pharmacology has advantages in determining the comprehensive mechanism of TCM treatment for asthma.
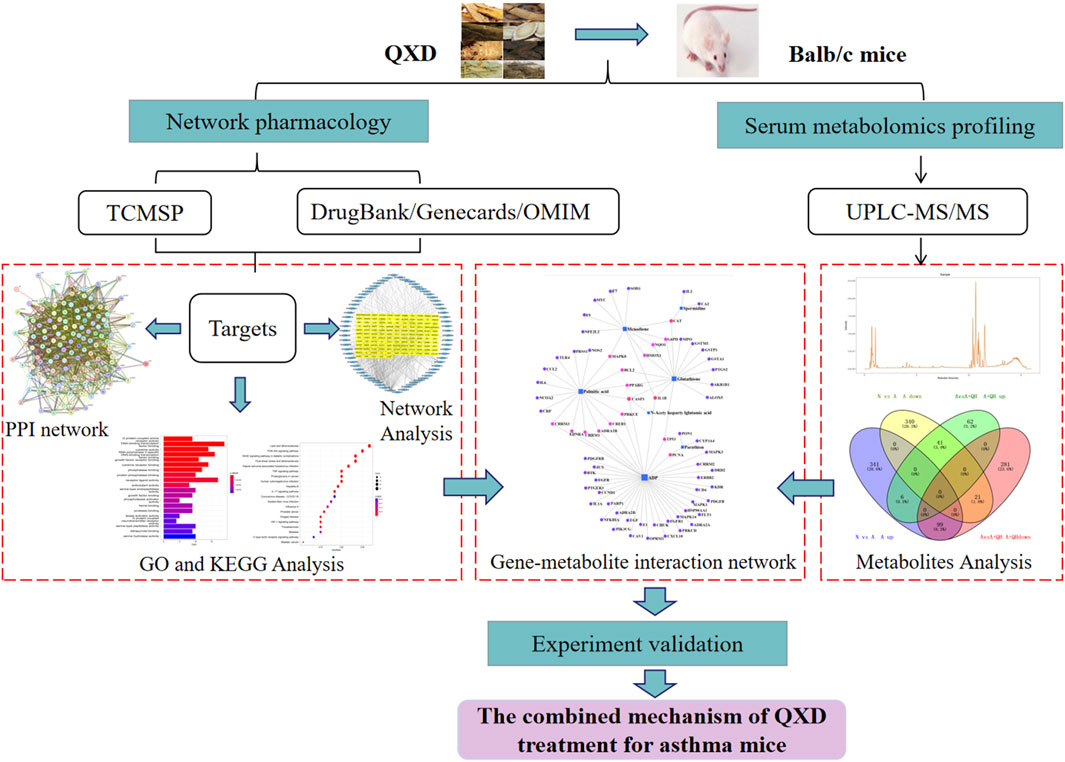
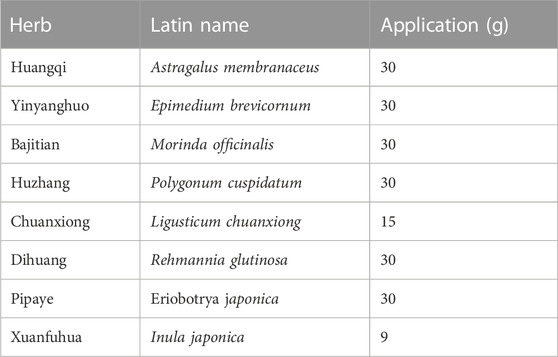
The Qi-Xian Decoction (QXD) has been used in the treatment of asthma for a decade and is composed of eight herbs: Astragalus membranaceus (Huangqi), Epimedium brevicornum (Yinyanghuo), Morinda officinalis (Bajitian), Polygonum cuspidatum (Huzhang), Ligusticum chuanxiong (Chuanxiong), Rehmannia glutinosa (Dihuang), Eriobotrya japonica (Pipaye), Inula japonica (Xuanfuhua). Our clinical study has demonstrated that QXD granules (Qixian Qingming Granules) exhibit significant anti-asthmatic effects, such as a notable reduction in exhaled nitric oxide levels and a decrease in the number of acute attacks within 1 year (Bi et al., 2020a). Furthermore, our studies have shown that QXD can alleviate airway inflammation and upregulate E-cadherin expression in human lung epithelial cells and ovalbumin-challenged mice by inhibiting ROS-mediated extracellular signal-regulated kinase (ERK) activation (Tang et al., 2020). However, the anti-asthma mechanism of QXD has not been fully elucidated. To further clarify the effective components, related targets, and pathways of QXD in treating asthma, we conducted metabolomic examination and network pharmacology analysis to identify the possible mechanisms and pathways for QXD in asthma treatment. The basic process of network pharmacological research and metabonomics validation of QXD treatment for asthma (Figure 1).
FIGURE 1
FIGURE 1. Entire study design based on metabolomics, network pharmacology and experimental verification.
2 Materials and methods2.1 OVA-challenged mouse model of asthma and QXD treatmentFemale BALB/c mice were used to build asthmatic model based on Henderson’s study (Henderson et al., 1996). 28 female Balb/c mice (20 ± 2 g), Four-week-old, SPF-grade, were purchased from Shanghai Jihui Experimental Animal Breeding Co., Ltd. License number (SCXK (Shanghai) 2017–0,012), and purchased in the animal room of Putuo District Central Hospital, license number (SYXK (Shanghai) 2022–0,002). The research was conducted in strict accordance with the National Institutes of Health Guide for the Care and received the approval of the institutional and local committees. Mice were randomly divided into four groups (n = 7): normal (N), asthma model (A), QXD low-dose treated (A + QL), and QXD high-dose treated (A + QH) groups. Except for the N group, the mice in the other groups were sensitised sensitizedvia intraperitoneal (ip.) injection of 200 µL sensitizing solution consisting of aluminium hydroxide and OVA on the 1st and 15th days, and then challenged by intranasal administration of 50 μL OVA on days 15, 26, 27, and 28. The mice in the A + QL and A + QH groups were orally administered QXD 0.25 mL and 0.5 mL (0.5 mL equal to a dose of 37.5 g/kg/d (Tang et al., 2020; Zhang et al., 2020) for 14 consecutive days, and the mice in the N and A groups were given 0.9% NaCl. On the 29th day, the mice were anaesthetised with isoflurane, and serum samples were collected for enzyme-linked immunosorbent assay (ELISA) and serum metabolomic analysis, which was performed using ultraperformance liquid chromatography-tandem mass spectrometry (UPLC-MS/MS). Lung tissues were collected for further analysis.
2.2 AHR examinationAHR in OVA-challenged mice was assessed using the WBP whole body plethysmography system (Tawang Intelligent, Shanghai, China). Each mouse was exposed to aerosolized doses of either PBS or methacholine (Mch) at concentrations of 3.125, 6.25, and 12.5 mg/mL for a duration of 3 min. Following the exposure, respiratory parameters were measured for a period of 5 min. The enhanced pause (Penh) values were recorded for each mouse in the different experimental groups and subsequently utilized for further analysis (Nilsson et al., 2022).
2.3 Cell cultureMH-S murine alveolar macrophage cell line was purchased from Zhong Qiao Xin Zhou Biotechnology Co., Ltd (Shanghai, China). MH-S cells were cultured in Roswell Park Memorial Institute (RPMI)-1,640 medium (Thermo Fisher Scientific, Waltham, United States) supplemented with 0.1% β-mercaptoethanol (Zhong Qiao Xin Zhou Biotechnology Co., Ltd., China), 10% foetal bovine serum (Moregate, Australia), and a penicillin/streptomycin solution. Cells were incubated at 37°C with 5% CO2.
2.4 Preparation of bovine serum albumin (BSA)-conjugated palmitic acid (PA)20 mM solution of PA (Sigma, 57–10–3) in 0.1 M NaOH was incubated at 70°C for 30 min, and was dissolved by mixing with 10% fatty acid-free foetal bovine serum in a 70 °C water bath.
2.5 QXD and QXD water extract (QXD-W) preparationEight herbs were purchased from Putuo Hospital (Shangyao Huayu Pharmaceutical Co., Ltd., Shanghai, China), and subjected to quality control. These herbs meet the required standards and specifications. The preparation methods used for QXD are consistent and follow the standard operating procedures for Chinese medicine preparations, and by meticulously evaluating the color, appearance, odor, and solubility of each batch of QXD, we can maintain quality control, ensuring consistency in therapeutic effectiveness and patient safety. In brief, two sets of QXD components were boiled with 2 L of water and concentrated to create a boiled water extract (QXD, 272 mL). It was stored at 4°C prior to administration to the mice. The composition of the formula are shown in Table 1. The QXD-W was obtained by using the same method described above, where 272 mL of QXD was obtained. It was then further concentrated to 0.45 L. The concentrated decoction was directly freeze-dried, resulting in 95.75 g of freeze-dried powder with an extraction rate of 30.11%. In vitro studies, the powder was dissolved in distilled water and used at a concentration of 80 ug/mL (Tang et al., 2020).
TABLE 1
TABLE 1. Composition of QXD.
2.6 Haematoxylin and eosin (HE) and alcian blue (AB)-periodic-acid schiff (PAS) stainingLung tissues were fixed in formalin solution. Following embedding in paraffin, the tissues were cut into 4 µm sections and stained with HE and AB-PAS solution. Images were captured using a microscope (Olympus BX43, Tokyo, Japan). The inflammation score was evaluated based on the infiltration of inflammatory cells around the airway [no inflammation (0 point); a little (1 point); more but not yet connected in a circle (2 points), a ring of inflammatory cells (3 points), infiltration of a large number of inflammatory cells (4 points)], and the percentage of airway goblet cells [no goblet cell coverage (0 point), 75% (4 points)] (Jiang et al., 2020).
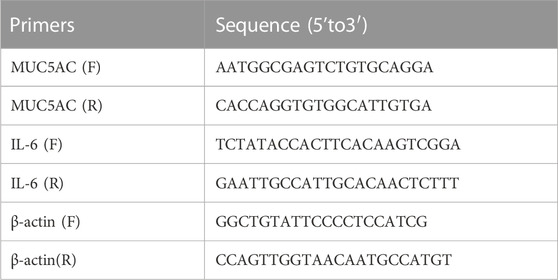
2.7 Real-time quantitative polymerase chain reaction (RT-qPCR)Total RNA was isolated from the cells and lung tissue using TRIzol reagent (TaKaRa, Dalian, China), and first-strand cDNA synthesis was performed using the PrimeScript RT reagent Kit (TaKaRa, Dalian, China). PCRs were performed using specific forward and reverse primers. RT-qPCR was performed using TB Green Master Mix (TaKaRa, Dalian, China). The relative expression levels of the mucin 5AC (MUC5AC) and IL-6 genes were normalised against β-actin and analysed using the 2−ΔΔCT method, as described previously (Ni et al., 2016). Primer sequences used in this study are listed in Table 2.
TABLE 2
TABLE 2. Sequences of primers.
2.8 Western blot (WB)Cell lysates were prepared using RIPA lysate buffer and subsequently centrifuged. The resulting supernatant was collected, and the protein concentration was determined using the BCA protein quantification kit (Beyotime, Shanghai, China). The total protein samples were separated on a 10% SDS-PAGE gel and subsequently transferred onto a polyvinylidene fluoride (PVDF) membrane (Miliipore, United States). The PVDF membrane was then blocked with 5% BSA for a duration of 2 h. Subsequently, the membrane was washed three times with Tris-buffered saline and Tween 20 (TBST) and incubated overnight at 4°C with primary antibodies against p-JNK (CST, United States) and GAPDH (Abcam, United States). On the following day, the membranes were washed three times with TBST and incubated with an anti-rabbit IgG horseradish peroxidase secondary antibody at room temperature for 2 h. Images were captured using a gel imaging analyzer (ImageQuant LAS, United States). Quantitative analysis was performed using ImageJ software.
2.9 ImmunofluorescenceThe tissue sections were deparaffinised in xylene, rehydrated in graded ethanol, and boiled in citrate buffer for antigen retrieval. Then, the sections were blocked with 5% BSA for 30 min and incubated with antibodies against CD11c antibody (Thermo Fisher Scientific, Waltham, United States) and IL-6 (Thermo Fisher Scientific, United States) at 4°C overnight. Subsequently, the tissue sections were washed three times with phosphate-buffered saline (PBS) and incubated with secondary antibodies with Alexa Fluor 488-conjugated anti-Syrian hamster IgG (Abcam, Cambridge, United States) and Cy3 conjugated anti-rabbit IgG (Abcam, United States). Finally, the sections were washed and stained with 4′,6-diamidino-2-phenylindole (DAPI). Immunofluorescence images were captured using a microscope (Leica DM13000B, Wetzlar, Germany).
2.10 Enzyme-linked immunosorbent assay (ELISA)Total IgE levels in mouse serum were detected using an IgE ELISA assay kit (Lianke, Hangzhou, China), PA levels in mouse serum were detected using a PA ELISA assay kit (Yaji, Shanghai, China), and IL-6 levels in the cell supernatant were determined using an IL-6 ELISA assay kit (ABclonal, Wuhan, China) according to the manufacturer’s instructions.
2.11 Bio-Plex cytokine assaysCell supernatants were analysed in 96-well microplates according to the manufacturer’s instructions; 23 targets were simultaneously quantified: IL-1α, IL-1β, IL-2, IL-3, IL-4, IL-5, IL-6, IL-9, IL-10, IL-12 (p40), IL-12 (p70), IL-13, IL-17, eotaxin, granulocyte colony-stimulating factor (G-CSF), granulocyte-macrophage (GM)-CSF, interferon (IFN)-γ, keratinocytes (KC), monocyte chemoattractant protein-1 (MCP-1), macrophage inflammatory protein-1 (MIP)-1α, MIP-1β, regulated on activation, normal T cell expressed and secreted (RANTES), and tumour necrosis factor (TNF)-α. Each specific reaction was quantified based on the strength of the fluorescence signal, and the content of each well was then pumped into the Bio-Plex 100 System array reader (Bio-Rad Laboratories, Shanghai, China). The obtained data were processed using Bio-Plex Manager software (version 6.1) and compared with the control group to convert the changes into multiple changes.
2.12 Network pharmacology analysisThe DrugBank (https://www.drugbank.ca/), Genecards database (https://www.genecards.org/), and Online Mendelian Inheritance in Man (OMIM) database (https://www.omim.org/) were used to search for asthma-related targets using “asthma” as the key word. The active ingredients from QXD and their corresponding targets were used to generate the “QXD-Compound-Target” network. TCM systems pharmacology database and analysis platform (TCMSP) (http://lsp.nwu.edu.cn/tcmsp.php) was used to search for QXD ingredients under the following screening conditions: oral bioavailability (OB)≥ 30% and drug-like (DL) ≥ 0.18, while the 72 compounds contained in the QXD obtained by mass spectrometry (Zhang et al., 2020), were included in the analysis, Compounds that did not contain the corresponding molecular formulas were excluded, and validated compounds were included in conjunction with literature reports. TCMSP was used to screen for the predicted target genes of the active ingredients. The predicted genes were integrated through UniProt (https://www.uniport.org/) and imported into the Search Tool for Retrieval of Interacting Genes/Proteins (STRING) platform (https://string-db.org/) to establish the protein-protein interaction (PPI) network map as target genes. The predicted genes were imported into Cytoscape 3.7.2 software to construct the “QXD-Compound-Target-Disease” network. In order to further analyse the Gene Ontology (GO) function and Kyoto Encyclopedia of Genes and Genomes (KEGG) pathway of the target genes, R software version 3.6.2 and the Bioconductor software package were used to construct the “drug-target-disease” network.
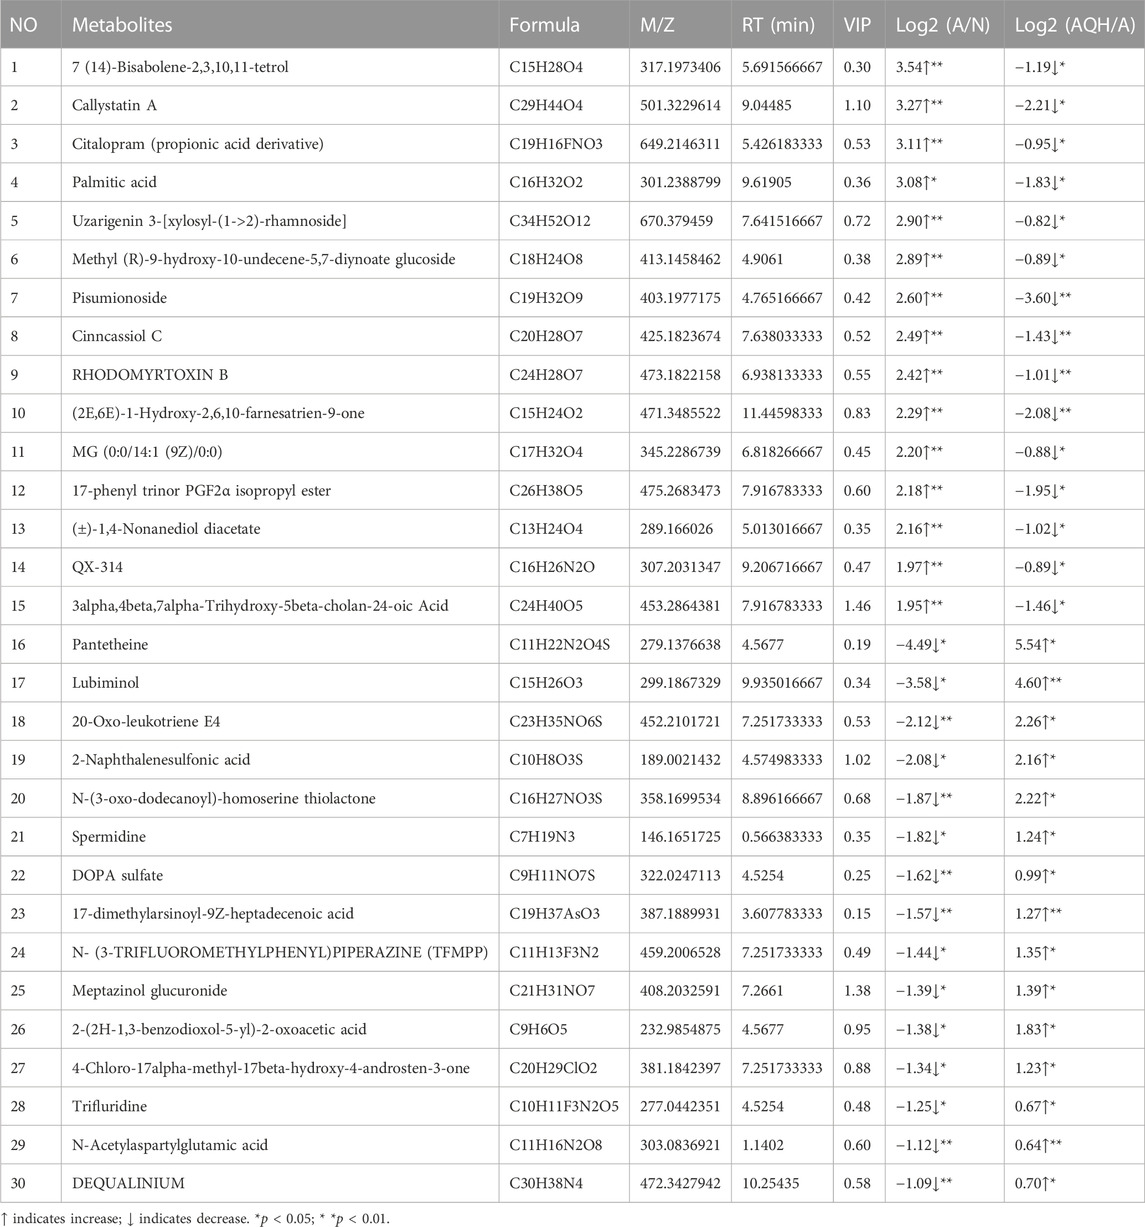
2.13 UPLC-QE-orbitrap-MS/MS detectionSerum sample was mixed with 20 μL of 2-chloro-l-phenylalanine (0.6 mg/mL), and 300 μL ice-cold mixture of methanol and acetonitrile (V:V = 2:1) were added. The mixtures were vortexed for 1 min, and the total samples were extracted by ultrasonication for 10 min in an ice-water bath and stored at −20°C for 30 min. After centrifugation at 13,000 rpm at 4°C for 10 min, 200 μL of the supernatant was dried and redissolved in 300 μL methanol-water (V:V = 1:4), the solution was vortexed for 30 s, extracted by ultrasonication for 3 min in an ice-water bat, then placed at −20°C for 2 h, centrifugation at 13,000 rpm at 4°C for 10 min, 150 μL supernatants were filtered with 0.22 μm microfilters and transferred to LC vials. UPLC-QE-Orbitrap-MS/MS analyses were used to examine in both ESI positive and ESI negative ion modes by using an ACQUITY UPLC HSS T3 (1.8 μm, 100*2.1 mm, Waters, Milford, United States) system. The mobile phase consisted of 0.1% formic acid used as mobile phases A and B, and this process was carried out with an elution gradient (0.01s–16s), delivered at 0.35 mL·min−1. The injection volume was 2 μL, and column temperature was 45°C. All the samples were kept at 4 °C during the analysis. The metabolite was detected by mass spectrophotometer scanning using a QE-HF mass spectrum detector (Thermo Fisher Scientific, Waltham, United States) from Oe biotech Co., Ltd (Shanghai, China). Full scan mode (100–1,200 m/z) combined with MSE mode for data acquisition was used. Differential metabolites with variable importance in projection (VIP) values >1.0 and p-values 1. A, C, E and G show the comparison between the N and A groups. B, D, F and H show the comparison between the A and A + QH groups. (I) Venn diagram analysin g differential metabolites between the N, A, and A + QH groups, The differential metabolites were selected based on the ratio of detected values and analyzed in conjunction with a significance threshold of p < 0.05. (J) Metabolic pathways were analysed based on 140 different metabolites by MetaboAnalyst 5.0, n = 7.
TABLE 3
TABLE 3. Differential metabolic signature after QXD treatment of asthma.
3.3 Network pharmacology analysisNetwork pharmacology was used to construct the asthma-gene-QXD network. We identified asthma-related genes (1,091 gene symbols) and core targets (2,448 gene symbols) corresponding to compounds contained in 8 herbs. We screened 126 genes associated with asthma and QXD (Table 4). Based on these 126 genes, we conducted protein-protein interaction (PPI) network analysis to display the interactions between these genes (Figure 4A). The top 20 genes are depicted in Figure 4B, which can be considered as core targets in the PPI network. Cytoscape was used to map the node relationships between 126 genes and 69 compounds (Figure 4C). After enrichment analysis of the GO function terms and KEGG pathways, 132 GO terms and 164 KEGG pathways were obtained. According to the number of enriched genes and P. adjust value