4. 一类数据(Max, Min, 交点)需要重点描述,、。
5. 注意句式的多样性,如在表达改变的过程中,下文采用了名词和动词的交替使用。
6. 注意灵活的使用近义词进行词汇替换。
参考范文:
The graph shows oil prices in dollars per barrel from 1995 with forecasts to 2015. Overall, oil prices increased by nearly four hundred percent from 1995 to 2008, with the most dramatic increase in the two years from 2006 to 2008. This rise is predicted to continue into the future.(开头段改写题目,并且描述总体趋势)
Prices started at around twenty US dollars a barrel during 1995, and then rose slightly to approximately twenty-four dollars in 1998. (起点+动作1,注意动作+幅度)
The cost of a barrel then dropped for two years, to the lowest point of about eighteen dollars during 2000. (Min, 一类数据必描述,注意数据双重性,同时注意cost=price,同替换义)After that, there was a steady price rise, reaching about fifty dollars a barrel in 2006. (there be 句式,名词化表达,句式多样性)
This was followed by a dramatic climb to over ninety dollars in 2008, and it is forecasted that this rise will continue into the future, and will level off slightly after 2010, with expectedly ending up at 130 price by 2015. (follow by 句式,名词化表达,注意描述数据的将来式应该用forecast, expect等表预测的词汇,结尾用end up)
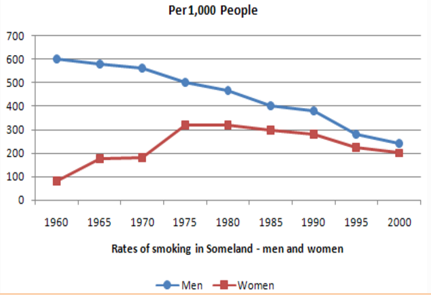
小作文线性图范文--男女吸烟者的比例
Task:The proportion of male and female smokers in Someland from 1960 to 2000.

思路解析:
1. 两条线,建议每条线一段;
2. 每条线的描述请参考经典折线写法(在数据库里有,详见《单线 指导写法》);
3. 关键性数据不可少,如最大值,最小值等;
4.