虽说雅思小作文占雅思写作分数只有1/3,但想要写好小作文也不容易。作为出题率很高的雅思图标作文,考生们不要轻视,小站雅思君诚意为你推荐优质雅思图表作文范文,供考生们借鉴模仿。
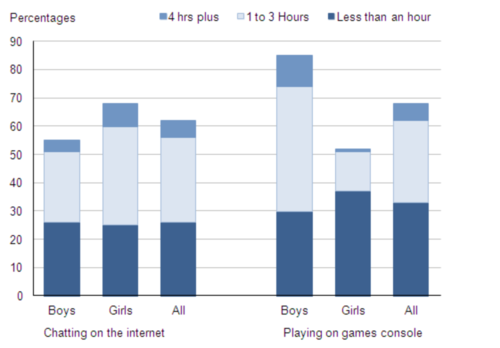
柱状图:网聊耗时
The chart below shows the amount of time that 10 to 15-year-olds spend chatting on the Internet and playing on games consoles on an average school day in the UK.

雅思图表作文范文1
Introduction
The bar chart compares the time spent by 10 to 15-year-olds in the UK on two activities, namely chatting online and playing computer games.
该柱状图比较了英国10至15岁青少年的两项活动,即在线聊天和玩电脑游戏。
Overview
Overall, we can see that playing computer games is marginally more popular than chatting on the Internet. However, completely different trends can be seen if we look at the specific figures for boys and girls. 总的来说,我们可以看到玩电脑游戏比在网上聊天更受欢迎。然而,如果我们看一下男孩和女孩的具体数字,就会发现完全不同的趋势。
Boys aged between 10 and 15 clearly favour playing on games consoles over chatting online. According to the chart, while 85% of boys play computer games every day, only 55% chat online daily. Furthermore, the majority of boys play on their consoles for more than one hour each day, and 10% do this activity for four hours or more. 年龄在10到15岁之间的男孩显然更喜欢打游戏。根据图表,85%的男孩每天玩电脑游戏,只有55%的人每天上网聊天。此外,大多数男孩每天在他们的游戏主机上玩一个多小时,10%的孩子在4个小时或更长时间内完成这项活动。
By contrast, girls prefer chatting online. Close to 70% of 10 to 15-year-old girls engage in online conversation each day, compared to about 50% of this cohort who play computer games. Of the girls who do play on consoles, most of them play for less than an hour, whereas most girls who chat online do so for more than one hour, and nearly 10% chat for four hours or more.(188)
相比之下,女孩更喜欢在网上聊天。在10到15岁的女孩中,有近70%的人每天都在网上聊天,而这一群体中有一半的人玩电脑游戏。在游戏主机上玩游戏的女孩中,大多数都玩了不到一个小时,而大多数在网上聊天的女孩都要玩一个多小时,而近10%的女孩聊天时间长达4个小时以上(188)。
饼图:游客分析
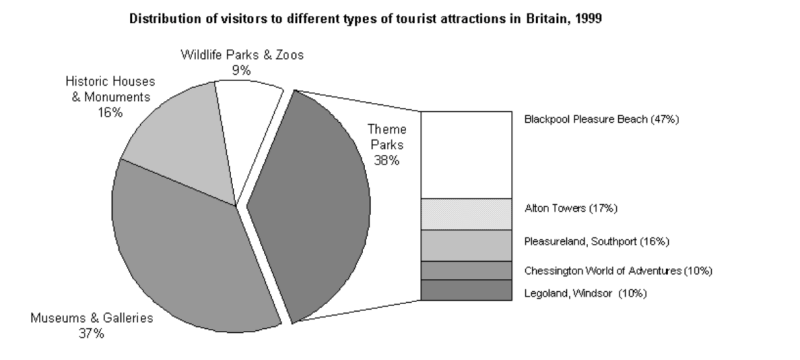
The chart below shows the results of a survey of people who visited four types of tourist attraction in Britain in the year 1999.

雅思表作文范文2
The pie chart compares figures for visitors to four categories of tourist attraction and to five different theme parks in Britain in 1999.
这个饼状图比较了1999年英国的四类旅游景点和5个不同主题公园的游客人数。
It is clear that theme parks and museums / galleries were the two most popular types of tourist attraction in that year. Blackpool Pleasure Beach received by far the highest proportion of visitors in the theme park sector.
很明显,主题公园和博物馆/画廊是那一年最受欢迎的两个旅游景点。在主题公园中,黑潭快乐海滩获得的游客比例是最高的。
Looking at the information in more detail, we can see that 38% of the surveyed visitors went to a theme park, and 37% of them went to a museum or gallery. By contrast, historic houses and monuments were visited by only 16% of the sample, while wildlife parks and zoos were the least popular of the four types of tourist attraction, with only 9% of visitors.
更详细地看这些信息,我们可以看到,38%的受访游客去了一个主题公园,其中37%的人去了博物馆或美术馆。相比之下,只有16%的样本参观了历史建筑和纪念碑,而野生动物公园和动物园则是这四种旅游景点中最不受欢迎的,只有9%的游客。
In the theme park sector, almost half of the people surveyed (47%) had been to Blackpool Pleasure Beach. Alton Towers was the second most popular amusement park, with 17% of the sample, followed by Pleasureland in Southport, with 16%. Finally, Chessington World of Adventures and Legoland Windsor had each welcomed 10% of the surveyed visitors.(181 words, band 9)
在主题公园领域,几乎一半的被调查者(47%)曾经到过布莱克浦的快乐海滩。奥尔顿塔是第二大最受欢迎的游乐园,有17%的样本,其次是在索斯波特的娱乐公园,占16%。最后,查辛顿冒险世界和乐高和温莎的游客都欢迎10%的游客。
线图:企业垃圾
The graph below shows the amounts of waste produced by three companies over a period of 15 years.

雅思图表作文范文3
The line graph compares three companies in terms of their waste output between the years 2000 and 2015. 从2000年到2015年,这条线图将三家公司的废物产出进行了比较。
It is clear that there were significant changes in the amounts of waste produced by all three companies shown on the graph. While companies A and B saw waste output fall over the 15-year period, the amount of waste produced by company C increased considerably.
很明显,图表上显示的这三家公司生产的垃圾量发生了重大变化。虽然A公司和B公司在15年的时间里看到了废物的产量下降,但C公司生产的废物量却大幅增加。
In 2000, company A produced 12 tonnes of waste, while companies B and C produced around 8 tonnes and 4 tonnes of waste material respectively. Over the following 5 years, the waste output of companies B and C rose by around 2 tonnes, but the figure for company A fell by approximately 1 tonne. 2000年,A公司生产了12吨废物,而B公司和C公司分别生产了大约8吨和4吨废料。在接下来的5年里,公司B和C的废料产量增加了大约2吨,但是公司A的产量下降了大约1吨。
From 2005 to 2015, company A cut waste production by roughly 3 tonnes, and company B reduced its waste by around 7 tonnes. By contrast, company C saw an increase in waste production of approximately 4 tonnes over the same 10-year period. By 2015, company C’s waste output had risen to 10 tonnes, while the respective amounts of waste from companies A and B had dropped to 8 tonnes and only 3 tonnes.(192 words, band 9)
从2005年到2015年,公司将废物产量减少了大约3吨,公司B减少了大约7吨的垃圾。相比之下,C公司在同样的10年时间里,废物产量增加了大约4吨。到2015年,C公司的废物产量已升至10吨,而A和B公司的垃圾量已降至8吨,仅为3吨。
混合图:英国移民
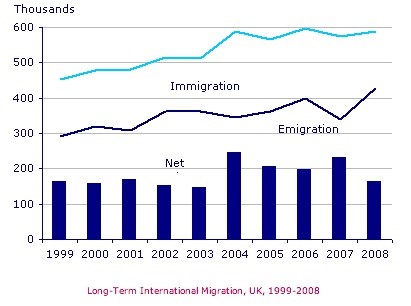
The chart below shows long-term international migration in UK.

雅思表作文范文4
The chart gives information about UK immigration, emigration and net migration between 1999 and 2008. 这张图表提供了1999年至2008年间英国移民、移民和净移民的信息。
Both immigration and emigration rates rose over the period shown, but the figures for immigration were significantly higher. Net migration peaked in 2004 and 2007. 移民和移民率在这段时间内都有所上升,但移民人数明显更高。净移民在2004年和2007年达到顶峰。
In 1999, over 450,000 people came to live in the UK, while the number of people who emigrated stood at just under 300,000. The figure for net migration was around 160,000, and it remained at a similar level until 2003. From 1999 to 2004, the immigration rate rose by nearly 150,000 people, but there was a much smaller rise in emigration. Net migration peaked at almost 250,000 people in 2004. 1999年,超过45万人在英国生活,而移民的人数不到30万人。净移民人数约为16万人,直到2003年才达到类似水平。从1999年到2004年,移民率上升了近15万人,但移民人数却少了很多。2004年,净移民人数达到近25万人的峰值。
After 2004, the rate of immigration remained high, but the number of people emigrating fluctuated. Emigration fell suddenly in 2007, before peaking at about 420,000 people in 2008. As a result, the net migration figure rose to around 240,000 in 2007, but fell back to around 160,000 in 2008.(159)
2004年之后,移民率仍然很高,但移民的人数却在波动。2007年移民突然减少,2008年达到了大约420,000人的峰值。结果,2007年净移民人数上升到24万,但在2008年又回落到16万左右。(159)
以上就是雅思小作文范文之雅思图表作文范文,