03 第三步:复盘总结
不断通过复盘思路、框架和可替换的论点,你将会总结出自己有规律的套路,不仅可以轻车熟路地快速成文,还可以避免使用市面上的模板带来的低分。
为了让大家能够系统地练习作文,咱们整理了英语大作文的范文:
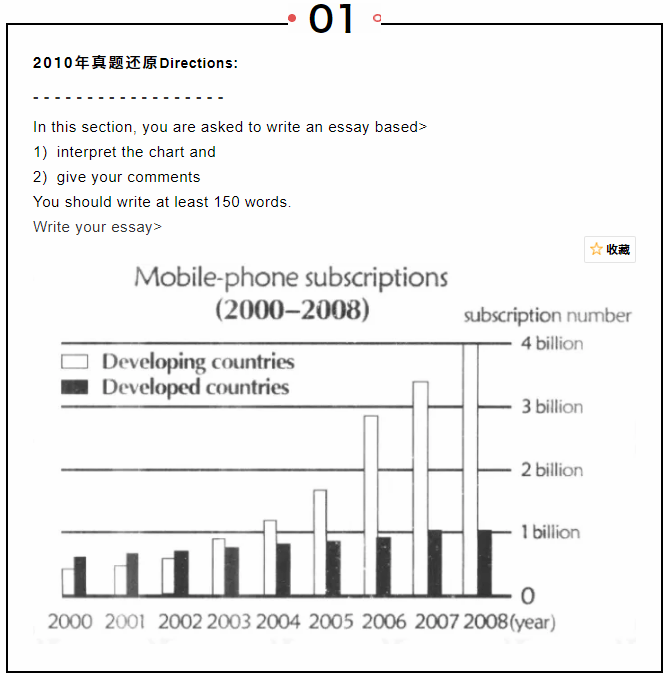
(描述图表)In this chart, we can see the mobile phone subscriptions in developed countries have a steady and slight increase from 1990 to 2007 and then remain constant in 2008. Meanwhile the mobile phone subscriptions in developing countries have witnessed a slow increase from 1990 to 2004 and then a great surge from 2004 to 2007: the biggest surge happens from 2005 to 2006.
(表达观点)This chart reflects different developing modes of mobile phone industry in developed and developing countries. The developed countries have a limited number of populations, most of whom are well-educated.
Therefore, the spreading of the mobile phone service is efficient and soon the market is saturated. On the other hand, at the top of the list is the recent huge improvement of the people's living standards in developing countries. It is reported that, with the rapid economic growth of these countries, mobile phone has become a life necessity rather than a luxury.
Moreover, we must admit that the developing countries has a far more larger population and accordingly a larger demand for mobile services than developed countries.
(总结)As discussed above, it is not surprising to see this difference. And I firmly believe that this established trend will continue for quite a while in the forthcoming years.
中文译文:
在这个图表中,我们可以看到,发达国家的手机用户在1990年至2007年期间有了稳定而轻微的增长,然后在2008年保持不变。与此同时,发展中国家的移动电话用户在1990年至2004年期间增长缓慢,在2004年至2007年期间急剧增加:最大的增长发生在2005年至2006年。
这张图表反映了发达国家和发展中国家移动电话产业不同的发展模式。发达国家的人口有限,其中大多数受过良好教育。因此,手机服务的普及效率很高,市场很快就饱和了。另一方面,图中最明显的是,发展中国家人民生活水平最近的大幅度改善。据报道,随着这些国家经济的快速发展,手机已成为一种生活必需品,而不是奢侈品。此外,我们必须承认,发展中国家的人口比发达国家大得多,因此对移动服务的需求也比发达国家大。
正如上面所讨论的,看到这种差异并不奇怪。我深信在未来数年,这个既定的趋势仍会持续一段时间。
▶范文使用指南:思考范文的思路、框架,要注意把你觉得有用的主题单词、词组、句子摘抄下来,多背多记!
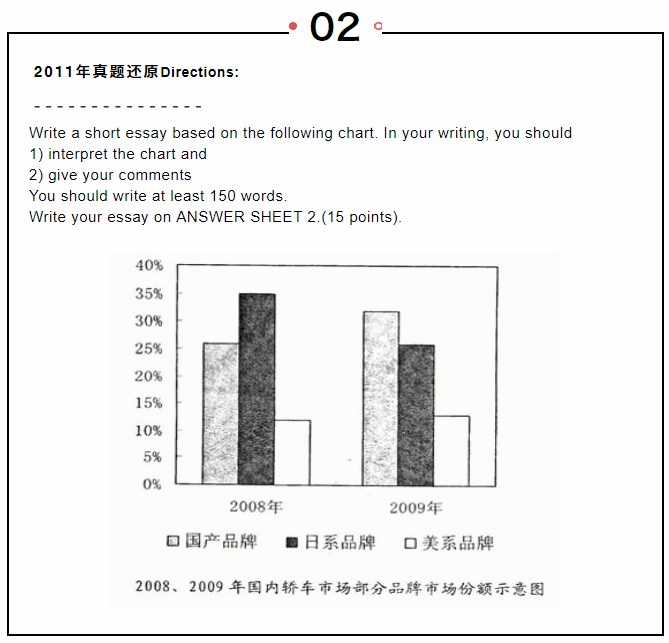
As it is shown in the bar chart above, dramatic changes have taken place in the autos market shares within two years (from 2008 to 2009). The most obvious change was the market share of national brand, which had increased nearly by 10%, while Japan's autos market share decreased roughly by 10%. The percentage of the US autos remained stable between 2008 and 2009.
The contributing factors for this phenomenon can be summarized as follows. Above all, as the development of technique and knowledge in native companies, a growing number of autos corporation developed many quality autos. Therefore, the national people changed the attitude to the native brands and acknowledge them.
What' more, an overwhelming majority of people have been affected by the country patriotism ideology, partly owing to some actions of Japan triggering the emotion of people. Finally, Toyota brake error accidents significantly affects Japanese autos' reputations and images.
Safety concerns drove customers away from Japanese products. Additionally, Fuel price drove consumers away from those American petrol digging and luxury autos. So it is not difficult to observe their steady performance.
Based on what has been discussed above, we may reasonably conclude that the tendency described in graphic will continue for quite a long time. Hopefully, government could offer more friendly policies to China autos manufacturers to encourage quality improvement and technology innovation.
▶中文译文:如上面的柱状图所示,在两年内(从2008年至2009年),汽车市场份额发生了巨大的变化。最明显的变化是民族品牌的市场份额增长了近10%,而日本汽车市场占有率下降了约10%。2008年至2009年期间,美国汽车的比例保持稳定。
造成这一现象的原因可归纳如下。首先,随着国内汽车企业技术和知识的发展,越来越多的汽车企业开发出了许多高质量的汽车。因此,中国人改变了对本土品牌的态度,并承认了他们。更有甚者,绝大多数人都受到国家爱国主义思想的影响,部分原因是日本的某些行为引发了人们的情绪。最后,丰田刹车失误事故对日本汽车的声誉和形象产生了重大影响。对安全的担心使顾客远离日本产品。此外,燃油价格驱使消费者远离那些美国耗油的豪华汽车。所以我们可以看到国产汽车的稳定业绩。
基于上面所讨论的,我们可以合理地得出结论,图形描述的趋势将持续相当长的时间。希望政府能为中国汽车制造商提供更友好的政策,以鼓励质量改进和技术创新。
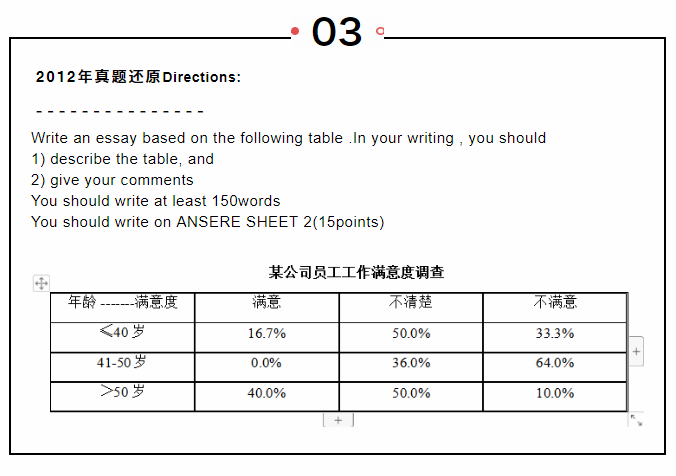
As can be seen from the table, there are some differences among staff of the company with regard to the satisfaction of their work.
Based upon the data of the table, most people under 40 are unclear(50%) or dissatisfied(33.3%) with their job, and 64% of those between 40 to 50, are not satisfied and no one feel satisfied at all. For people over 50, the degree of satisfaction largely exceeds the other groups, amounting to 40%.
Such difference may be rooted in the following reasons. First, middle-aged people face more pressure to support the family, both the children and the senior, so that they neglect to enjoy in work.
Second, the senior citizens has developed a lot in personality, so they are more prone to see the optimistic aspects of the work. Last but not the least, the fact cannot be neglected that most of the staff under their forties cannot see the slightest prospect of promotion.
In view of the argument above , I strongly believe that the staff's attitude towards satisfaction with their work reflects the situation of their work. Therefore, the company should take measures for the staffs so that they can find more satisfaction with work.
▶中文译文:从上表可以看出,公司的员工对工作的满意度有所不同。根据表中的数据,40岁以下的大多数人对工作满意度模糊的(50%)或不满意(33.3%),40至50岁的人中64%不满意,没有人感到完全满意。对于50岁以上的人,满意度大大超过其他群体,达到40%。
这种差异可能源于以下原因。首先,中年人面临